
|
SPPIDERSolvent accessibility based Protein-Protein InterfaceiDEntification and Recognition |
Index |


|
About SPPIDER
The SPPIDER protein interface recognition server can be used to: (1) predict residues to be at the putative protein interface(s) by considering single protein chain with resolved 3D structure; (2) analyse protein-protein complex with given 3D structural information and identify residues that are being in interchain contact.
Training and control sets of proteins used for SPPIDER training and
validation:
S435 - Training set
and its
homologous complexes
S149 - Control set
and its
homologous complexes
S21(S21a) - Subset of
control set that has individually crystallized chains - homologs
API: For automated submissions a perl script can be used
provided here.
The zip achive contains two files: the perl script and
example of a list file with PDB codes.
Don't forget to keep a delay between requests for at least
15 seconds or your IP address will be banned.
Types of queries
Currently, there are two available types of queries:
(1) Recognition of putative interacting sites for protein-protein interaction based on consensus classifier. It is able to determine the residues that are potentially take part in some protein-protein interactions. Predicted interacting sites may belong to the different protein interfaces. Accuracy of recognition can be adjusted using Tradeoff option (see below). Requests of this type go to the machine cluster queuing system and are being processed in the order received. Thus, recognition results may be delayed and can be optionally sent via e-mail.
(2) Identification of protein interface within protein-protein complex, which one can submit in the PDB format by either specifying registered PDB entry code or uploading custom PDB file. Based on 3D structure analysis, server will issue a precise information about what the actual residues are involved in a given protein-protein interaction. But it won't be able to tell anything beyond that, for example, if there are alternative active sites within each participating protein chain. Automatic identification is performed in real-time and usually one can get results immediately.
Note, that for each type of query a set of options is different.
Query options
- Interacting sites recognition within single protein chain
-
E-Mail address is an optional setting to let user obtain results via e-mail without waiting for on-line output, which might take a while. A link for the visualization of results is provided in e-mail message.
-
PDB code and PDB file are fields to specify either existing PDB entry or custom protein structure.
-
Chain label is to select a chain of interest if PDB file represents more than one protein chain. If option is omitted, first defined chain is taken for its interacting sites prediction.
-
Version is to choose the strategy of prediction: to have higher sensitivity or better specificity. What is the difference between versions I and II?
Briefly, SPPIDER I (February 2005) has higher recall (sensitivity), while SPPIDER II (February 2006) shows higher precision (specificity) and per residue accuracy. And both versions have the same correlation coefficient (see table below).
In details, (i) feature space they use differs in one parameter; (ii) SPPIDER II was trained on smaller but cleaner and better annotated training set.
Below is a table with performances of both versions applied to the same control set of 149 protein chains (19977 vectors), baseline Q2=65% with no sequence homology to the training set.Version Accuracy MCC Q2, % Recall, % Precision, % I 0.42 72.48 67.71 59.23 II 0.42 74.18 60.30 63.72 -
Tradeoff between Sensitivity and Specificity is an option for adjusting results according to the purpose of search. Within each SPPIDER version, one can reach a high degree of recall for putatively interfacial residues having in the same time low level of precision to the knowledge about interfacial residues. Although, it should not be discouraging since many negatives can be false just because of the lack of information about protein-protein interaction. Estimates for tradeoff between sensitivity and specificity are represented in table below based on control set consisting of 19977 vectors, baseline Q2=65% with no sequence homology to the training set.
SPPIDER I Tradeoff SPPIDER II MCC Q2, % R, % P, % MCC Q2, % R, % P, % 0.38 67.62 76.92 52.45 0.1 0.40 71.13 70.26 56.99 0.39 69.79 73.46 55.01 0.2 0.41 72.63 66.23 59.70 0.40 70.86 71.20 56.54 0.3 0.42 73.37 63.83 61.38 0.41 71.65 69.26 57.81 0.4 0.42 73.89 61.91 62.75 0.42 72.48 67.71 59.23 0.5 0.42 74.18 60.30 63.72 0.42 73.25 66.13 60.70 0.6 0.42 74.25 58.31 64.47 0.42 73.49 64.27 61.49 0.7 0.42 74.35 56.27 65.37 0.42 73.82 62.36 62.50 0.8 0.42 74.57 54.48 66.55 0.42 74.13 59.82 63.77 0.9 0.42 74.71 52.32 67.82 0.42 74.59 55.77 66.09 1.0 0.41 74.69 48.91 69.49 Where MCC - Matthew's correlation coefficient, Q2 - percent of correctly classified vectors in two-class problem, R - recall (sensitivity) and P - precision (specificity).
-
Generate PDB file with prediction encoded by B-factors setting supplys user with downloadable file in the PDB format modified to contain target chain only and B-factors values changed to either two-state classification output (0.00 - Negative class or 100.00 - Positive class) or probabilities of residue to be at interface depending on option selected. Thus, prediction results can be easily visualized in 3D using this PDB file with any molecular modeling software that supports coloring atoms by temperature or B-factors. In SPPIDER output, it can be viewed by JMol java-applet.
Add information about known interactions option provides user with possibility to retrieve information about known interacting sites derived from PDB. This data can be either attached to or contrasted with prediction results as independent section in the output. System for known protein interaction data analysis and retrieval is implemented as independent service - SCORPPION. WARNING: use this option with caution as it is still under active development and did not pass the thorough testing. Thus, results obtained using this option are not fully reliable.
Add solvent accessibility prediction results to e-mail message option lets user to get SABLE prediction results for protein secondary structure and relative solvent accessibility as a main data contributor to the feature space used for interface recognition in our classifier. It might be helpful for the results analysis.
-
- Interface identification within protein-protein complex
-
PDB code is to be the registered entry code at the Protein Data Bank server and has to represent a protein-protein complex with at least 2 protein chains.
-
PDB file is a custom file in the PDB format. It should contain at least 2 protein chains.
-
RSA change threshold is an option to adjust identification system for the user's need. In literature, different research groups use various relative solvent accessibility change as a threshold for assigning residue to be in the interface or non-interacting. Option provides user with the possibility to set up RSA change threshold in both absolute (Å2) and relative (% of maximal surface exposed area for given amino acid) surface scale.
-
Output setting specifies how protein interface analysis is supposed to be presented: as a summary of all interacting residues within each chain, or as a pairwise interfaces for each pair of chains separately, which makes further analysis easier in case of complexes with multiple chains involved in the interaction.
-
For both types of query, plain text output is available, which can be used for further parsing. Beside the text, server provides a graphical visualization of the results. Default view for query type 1 is made by POLYVIEW, whereas for query type 2 the default option is JMol (which requires Java to be installed on computer and java-applets to be enabled in web-browser). But user can also follow the links provided to receive enchanced views either by POLYVIEW-3D or by Protein Explorer.
Examples of prediction
Apart from 2D output generated by POLYVIEW visualizer (for details, refer to its documentation), one can get a 3D animated image of the whole query protein as well as publication quality static slides (see tutorial).
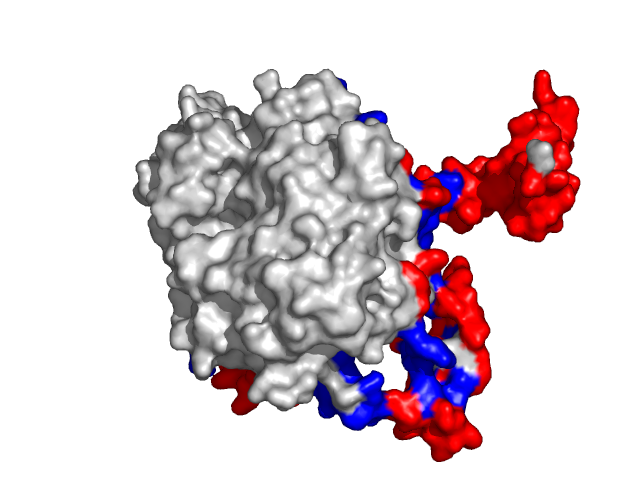
Examples of SPPIDER I prediction (click on picture to see animated image - big files!).
- Colored ribbons (if any) - chains beyond prediction
- White CPK - target chain
- Red CPK - atoms in residues predicted to be at interface
 |
 |
|
Query protein is GROEL/GROES complex (PDB code 1aon) with
target chain A.
|
Query protein is Deoxyhemoglobin Rothschild
(PDB code 1hba) with target chain A.
|
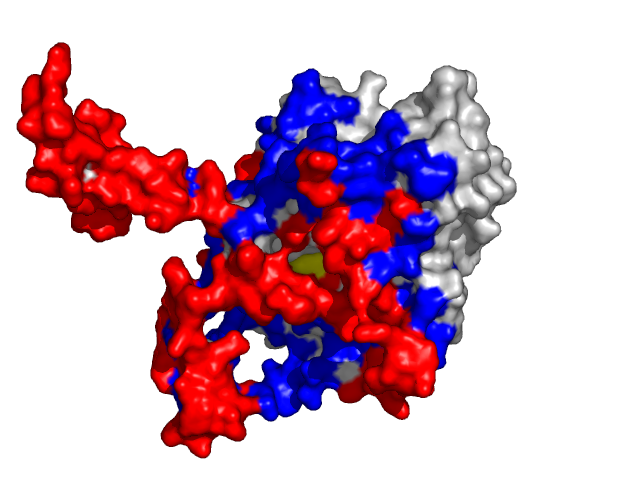
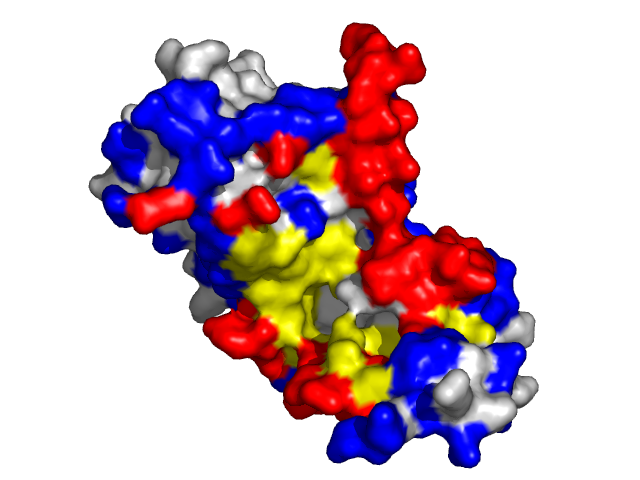
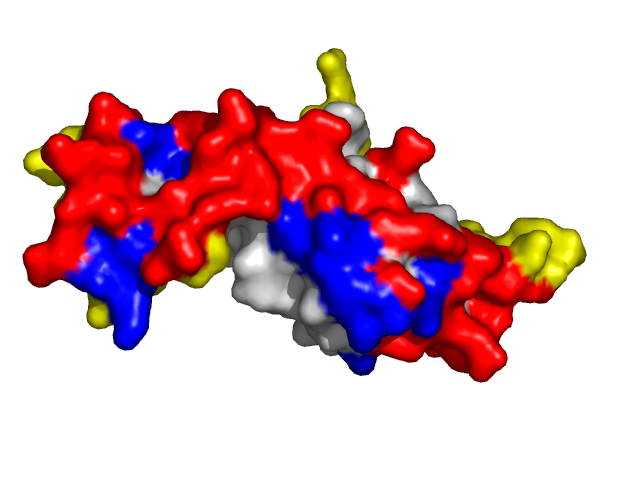
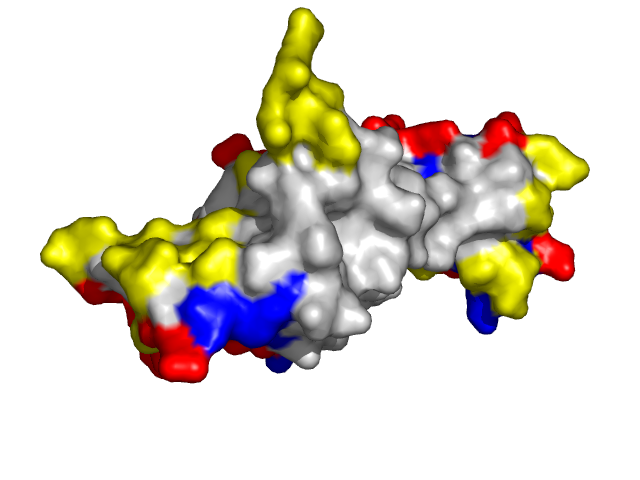
Examples of SPPIDER II prediction (front and rear view). Target proteins were not included in the training set and have no sequence redundancy to any of the training proteins.
- Red - true positives (residues correctly predicted to be at interface)
- White - true negatives (residues with no functional annotation)
- Yellow - false positives (residues wrongly predicted to be at interface)
- Blue - false negatives (known but not recognized interfacial residues)
 |
 |
| Human erythrocyte catalase as a part of the oxidoreductase complex (PDB entry 1f4j, chain A). | |
 |
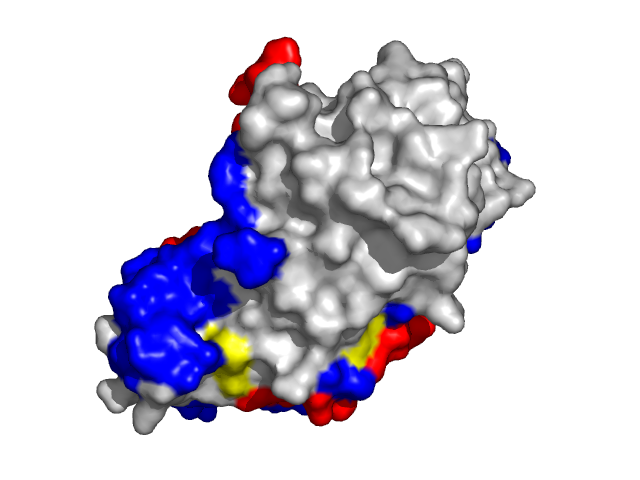 |
| Cyclin-dependent kinase 6 (CDK6) as a part of the p18(ink4c)-cdk6-k-cyclin ternary complex (1g3n:A). | |
 |
 |
| Von Hippel-Lindau disease tumor suppressor from the pvhl/elongin-c/elongin-b complex (1lqb:C). | |
Information about protein binding sites was derived from complexes containing target protein chains and available at PDB and further mapped to the corresponding structures specified above (1f4j:A -- 1f4j, 1dgb, 1dgf, 1dgg, 1dgh, 1qqw, 1tgu, 1th2, 1th3, 1th4, 4blc, 8cat; 1g3n:A -- 1g3n, 1bi7, 1bi8, 1blx, 1xo2, 1jow; 1lqb:C -- 1lqb, 1lm8, 1vcb).
Comparison with other predictors
We have recently performed a large scale evaluation of SPPIDER in comparison with other structure-based methods for prediction of protein-protein interaction sites available online as web-servers. Evaluated servers include Evolutionary Trace method, ConSurf, PROMATE, Cons-PPISP, WHISCY, PIER, and SPPIDER. Three benchmark sets were used: the SPPIDER control set (Porollo and Meller, 2007, Proteins), protein docking benchmarks containing both bound and unbound proteins (Albou et al., 2008, Proteins; Hwang et al., 2008, Proteins).
The detailed survey can be found in the book chapter Porollo A, Meller J. Computational Methods for Prediction of Protein-Protein Interaction Sites. In: Protein-Protein Interactions - Computational and Experimental Tools; W. Cai and H. Hong, Eds. InTech 2012; 472: pp. 3-26. The book chapter discusses the effects of protein interaction site definition and mapping from homologous complexes. Among different angles of assessment, the survey also evaluates the methods using bound and unbound forms of proteins in the benchmark sets.
Both the book chapter and the entire book are with open access.
References
|
|
Reference to the SPPIDER method: A. Porollo, J. MellerPrediction-based Fingerprints of Protein-Protein Interactions Proteins: Structure, Function and Bioinformatics (2007) 66: 630-45. |
|
|
Reference to the survey of methods for prediction of protein-protein interaction sites: A. Porollo, J. MellerComputational Methods for Prediction of Protein-Protein Interaction Sites. In: Protein-Protein Interactions - Computational and Experimental Tools; W. Cai and H. Hong, Eds. InTech 2012; 472: pp. 3-26. |
Acknowledgement
This work was supported by the
University of Cincinnati College of Medicine,
Cincinnati Children's Hospital Research Foundation, and
NIH through grants: AI055338, R01 AR050688, 5R01GM067823-02.
Back to the SPPIDER server home page